Edit chart
Loading graph
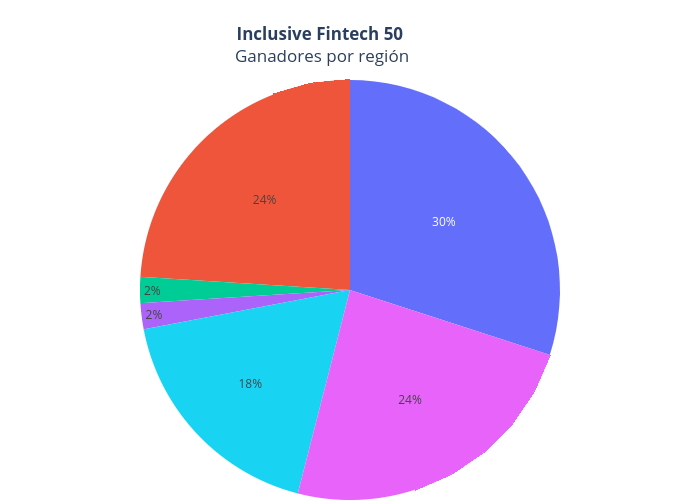
Iupana's interactive graph and data of "Inclusive Fintech 50 Ganadores por región" is a pie, showing Applicants to Inclusive Fintech 50, by region. The x-axis shows values from -1 to 6. The y-axis shows values from 2.0051369863013697 to 3.683219178082192.